
The Guitar String Problem
by
Laura Kimbel
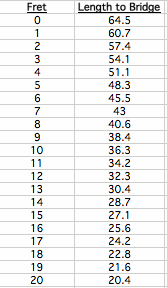
The following data set is obtained by measuring the length (cm) of the strings on a guitar from each fret to the bridge of the guitar.

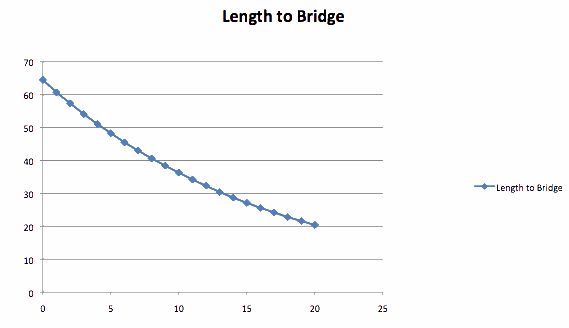
If we plot these points in a graph, we can see the general trend of these lengths.

We can see above, that when we plot our points, it depicts a decreasing function. However, it does not appear to be perfectly linear. Using excel, we can attempt to fit an exponential regression curve to our data.
Using the exponential regression fitting tool, we can find a function that fits our data. Let's call it f.
![]()
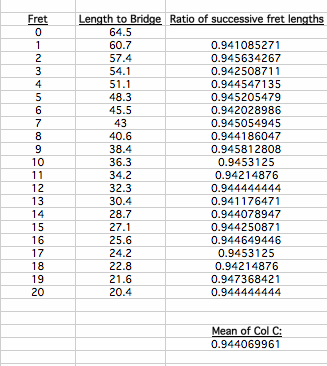
Is there another way to come up with this function? Let's examine the ratio of successive fret lengths.

We can see that the ratio between successive frets is almost the same throughout. The arithmetic mean of these values is 0.9441. So, what if we think about the ratio between fret 0 and fret 2?
57.4 / 64.5 = .8899 = (0.9441)(0.9441)
Similarly, the ratio between fret 0 and fret 3 is:
54.1 / 64.5 = 0.8388 = (0.9441)(0.9441)(0.9441).
So, if we let the fret number represent our x-value, and the length to represent the y-value, we can come up with a function to represent this data. (Let's choose the point (0, 64.5).)
![]() .
.
This function the we have obtained, is very close to the one that we generated using the provided technology.
What if we had a 21st fret? What would the distance be to the bridge of the guitar?
When x = 21, f (21) = 19.27
What if we wanted to know the closest fret that was 15 cm from the bridge? (assuming this fret exists)
What x-value satisfies f (x) = 15?
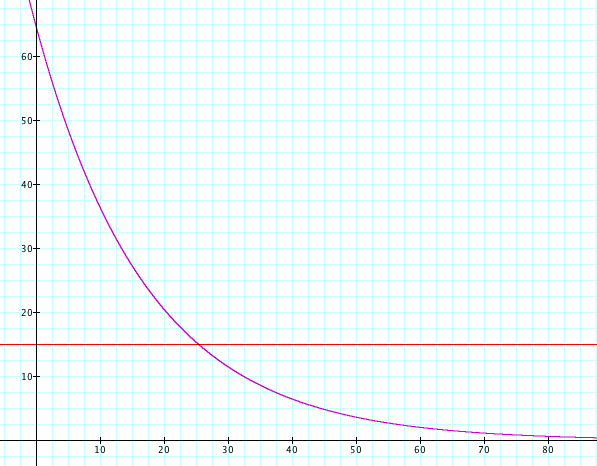
One way to do this is to graph the line y = 15 on our calculator and see where it intersects the exponential line that we found to fit our data.

These 2 functions intersect at x = 25.36. This is closer to fret 25.
Excel and other technologies can be very helpful when examining data. Once we find a function that fits our data, we can analyze even more situations.